data-100
An assignment index for Professor Frazier's DATA 100 class
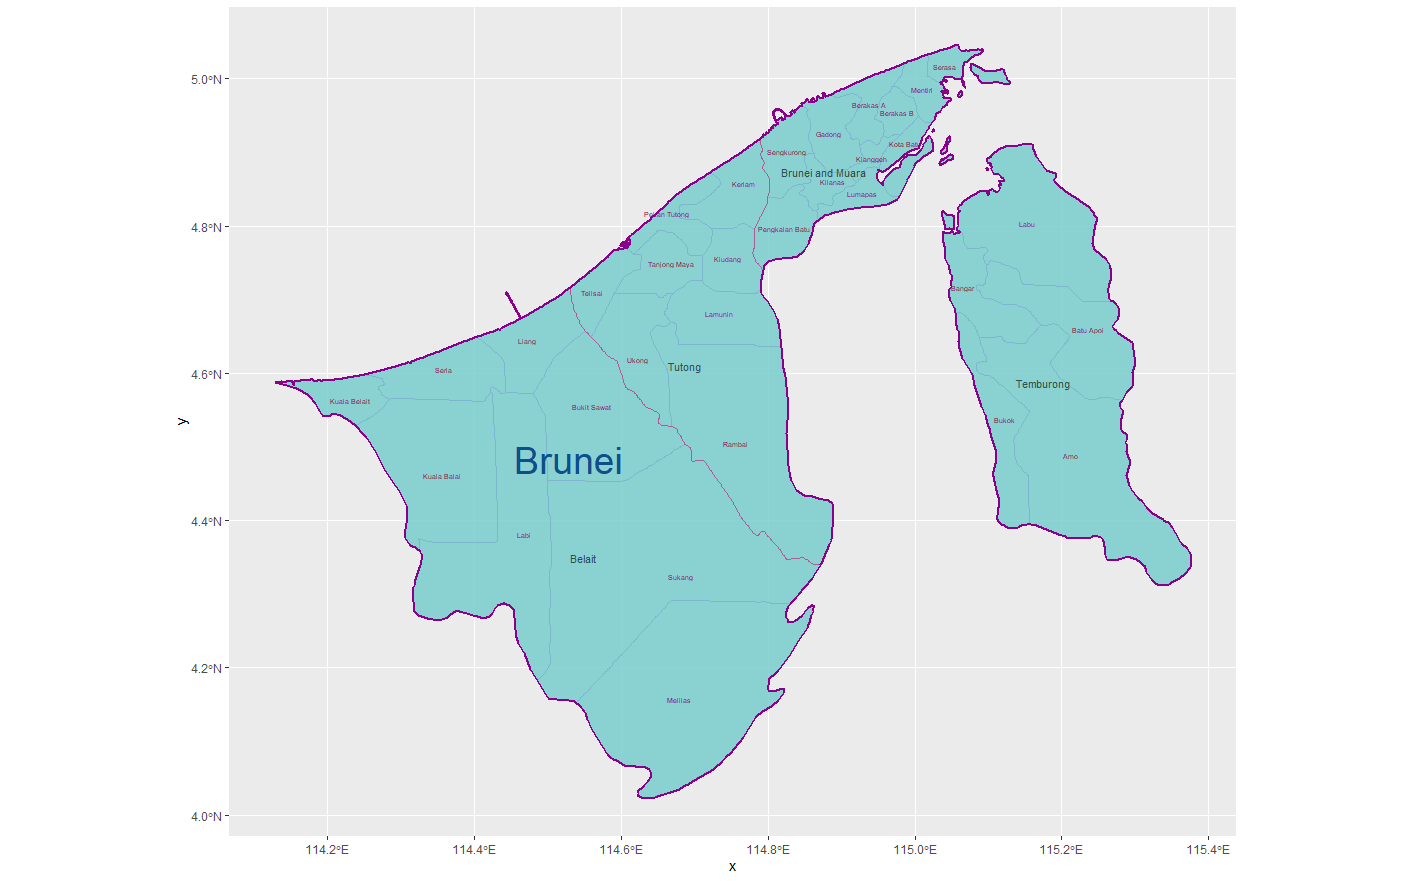
Assignment 1: Plotting and Labelling Administrative Subdivisions
For this assignment, I used shapefiles representing the small island country of Brunei to plot a map of the country’s international borders, administrative boundaries, and county subdivisions. I utilized libraries, ggplot(), .shp files, and labelling tools to create my own map.
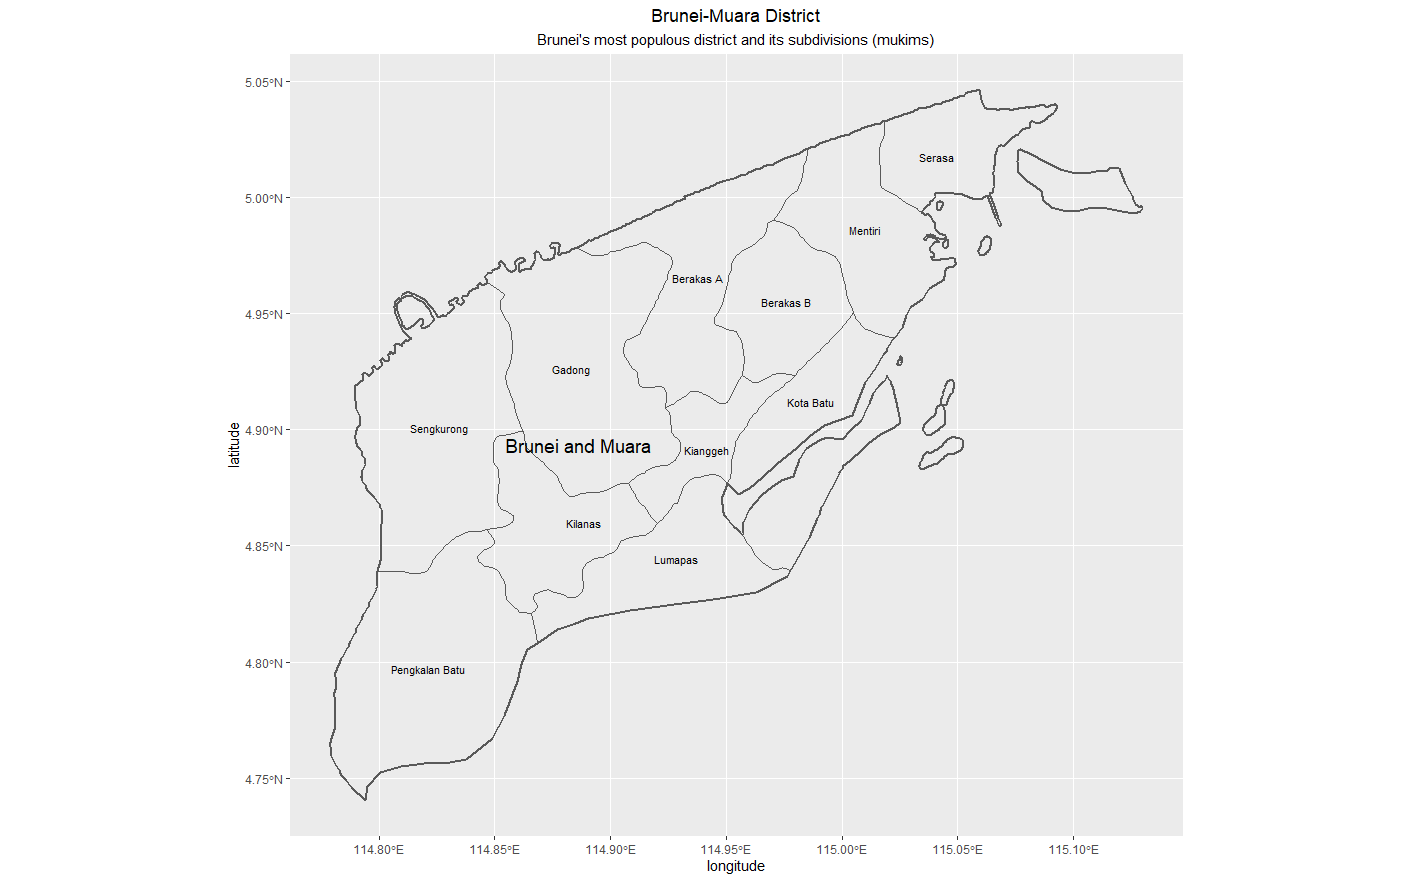
Stretch Goals
One of the stretch goals associated with this assignment involved isolating the most populous county of a country and plotting it. In Brunei, the most highly-populated county is Brunei & Muara, which has several smaller subdivisions contained within it. Mapping this county and its subdivisions with ggplot() created the image below.